points_inside_polygon#
- cherab.lhd.emc3.inversion.polygon.points_inside_polygon(range_l: tuple[int, int], range_m: tuple[int, int], n: cython.int = -1, zone: str = 'zone0', min_points: cython.int = 200, ratio: cython.float = 0.0) np.ndarray#
Generate random points inside the polygon.
This function is a wrapper of the Cython function
._points_inside_polygon.The polygon is defined by the vertices of the EMC3 grid.
- Parameters:
- range_l
tuple[int,int] Range of radial indices.
- range_m
tuple[int,int] Range of poloidal indices.
- n
int Index number of toroidal direction, by default -1.
- zone
str Name of zone, by default
"zone0".- min_points
int Number of points to generate, by default 200.
- ratio
float Ratio to area of the polygon, by default 0.0. 0.0 means that the number of points is always
min_points.
- range_l
- Returns:
- (
N, 2)ndarray Array of points inside the polygon.
- (
Examples
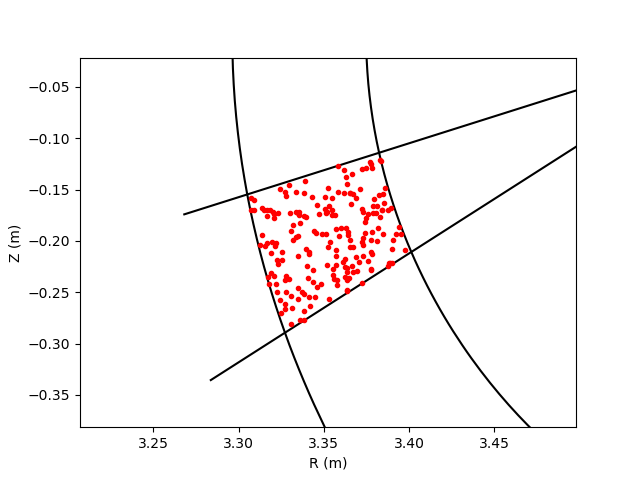
>>> points_inside = points_inside_polygon((10, 20), (10, 20), n=0, zone="zone0")
>>> points_inside.shape
(134, 2)  # The number of points is random
Show the points and EMC3 grid at the poloidal cross-section.
from matplotlib import pyplot as plt
from cherab.lhd.emc3 import Grid

grid = Grid("zone0")
plt.plot(grid[:, 10, 0, 0], grid[:, 10, 0, 1], "k-")  # plot radial lines (m=10)
plt.plot(grid[:, 20, 0, 0], grid[:, 20, 0, 1], "k-")  # plot poloidal lines (m=20)
plt.plot(grid[10, :, 0, 0], grid[10, :, 0, 1], "k-")  # plot poloidal lines (l=10)
plt.plot(grid[20, :, 0, 0], grid[20, :, 0, 1], "k-")  # plot poloidal lines (l=20)
plt.plot(points_inside[:, 0], points_inside[:, 1], "r.")  # plot points inside polygon
plt.xlim(points_inside[:, 0].min() - 0.1, points_inside[:, 0].max() + 0.1)
plt.ylim((points_inside[:, 1].min() - 0.1, points_inside[:, 1].max() + 0.1))
plt.xlabel("R (m)"); plt.ylabel("Z (m)")
plt.show()