plot_coarse()#
- Grid.plot_coarse(**kwargs)Source#
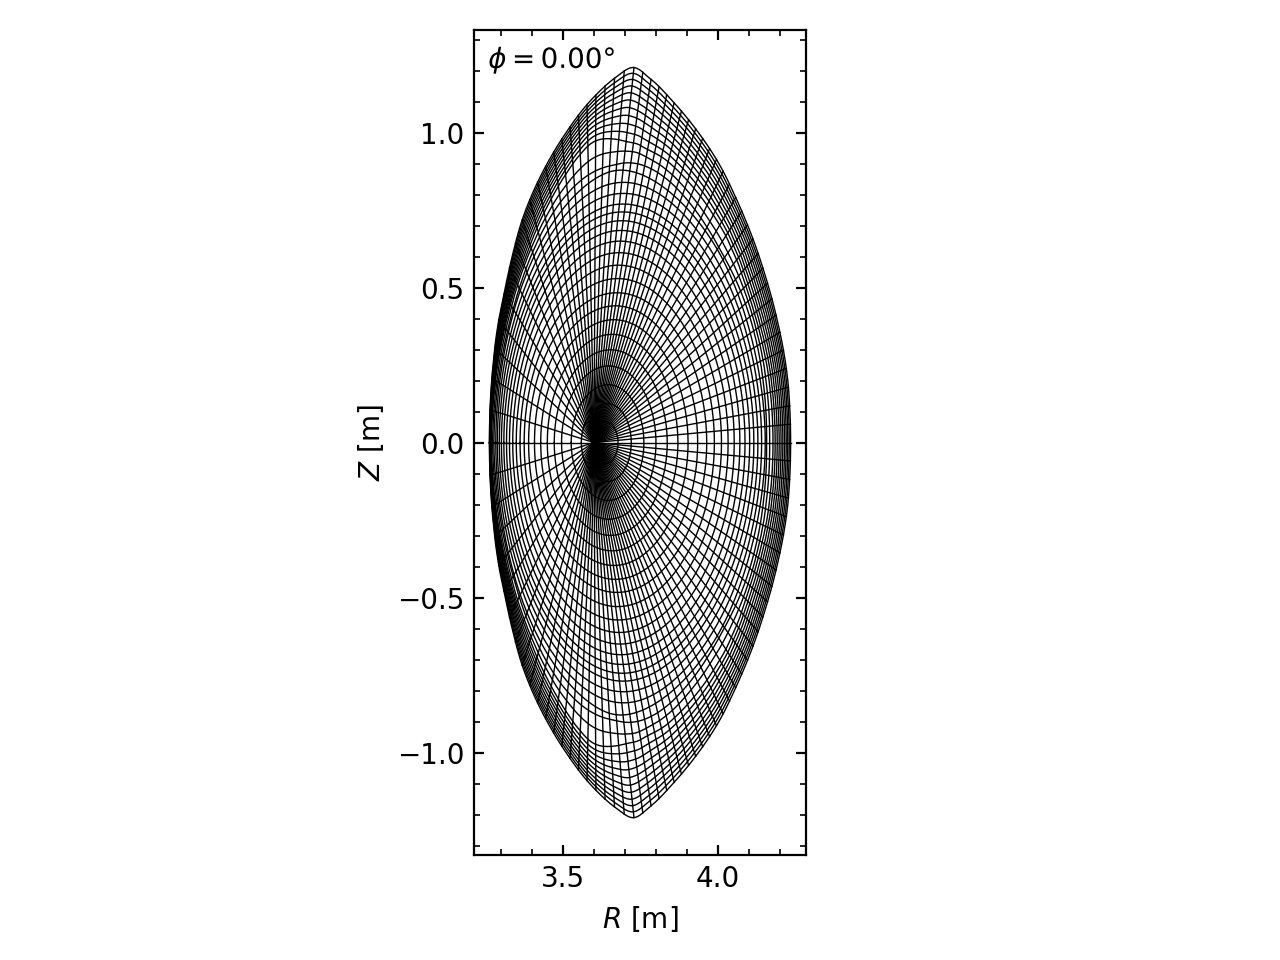
Plotting EMC-EIRENE-defined coarse grids in \(R–Z\) plane.
The indices to use as the coarse grid is stored in attributes of
"/index/coarse"variables. So this method is available only if they are stored.Coarse grid indices are created by
install_indicesfunction.- Parameters:
- Returns:
Examples
>>> grid = Grid("zone0")
>>> grid.plot_coarse()