plot()#
- Grid.plot(fig: Figure | None = None, ax: Axes | None = None, n_phi: int = 0, rz_range: tuple[float, float, float, float] | None = None, show_phi: bool = True, indices_radial: Buffer | _SupportsArray[dtype[Any]] | _NestedSequence[_SupportsArray[dtype[Any]]] | bool | int | float | complex | str | bytes | _NestedSequence[bool | int | float | complex | str | bytes] | slice | None = None, indices_poloidal: Buffer | _SupportsArray[dtype[Any]] | _NestedSequence[_SupportsArray[dtype[Any]]] | bool | int | float | complex | str | bytes | _NestedSequence[bool | int | float | complex | str | bytes] | slice | None = None, **kwargs) tuple[Figure | None, Axes]Source#
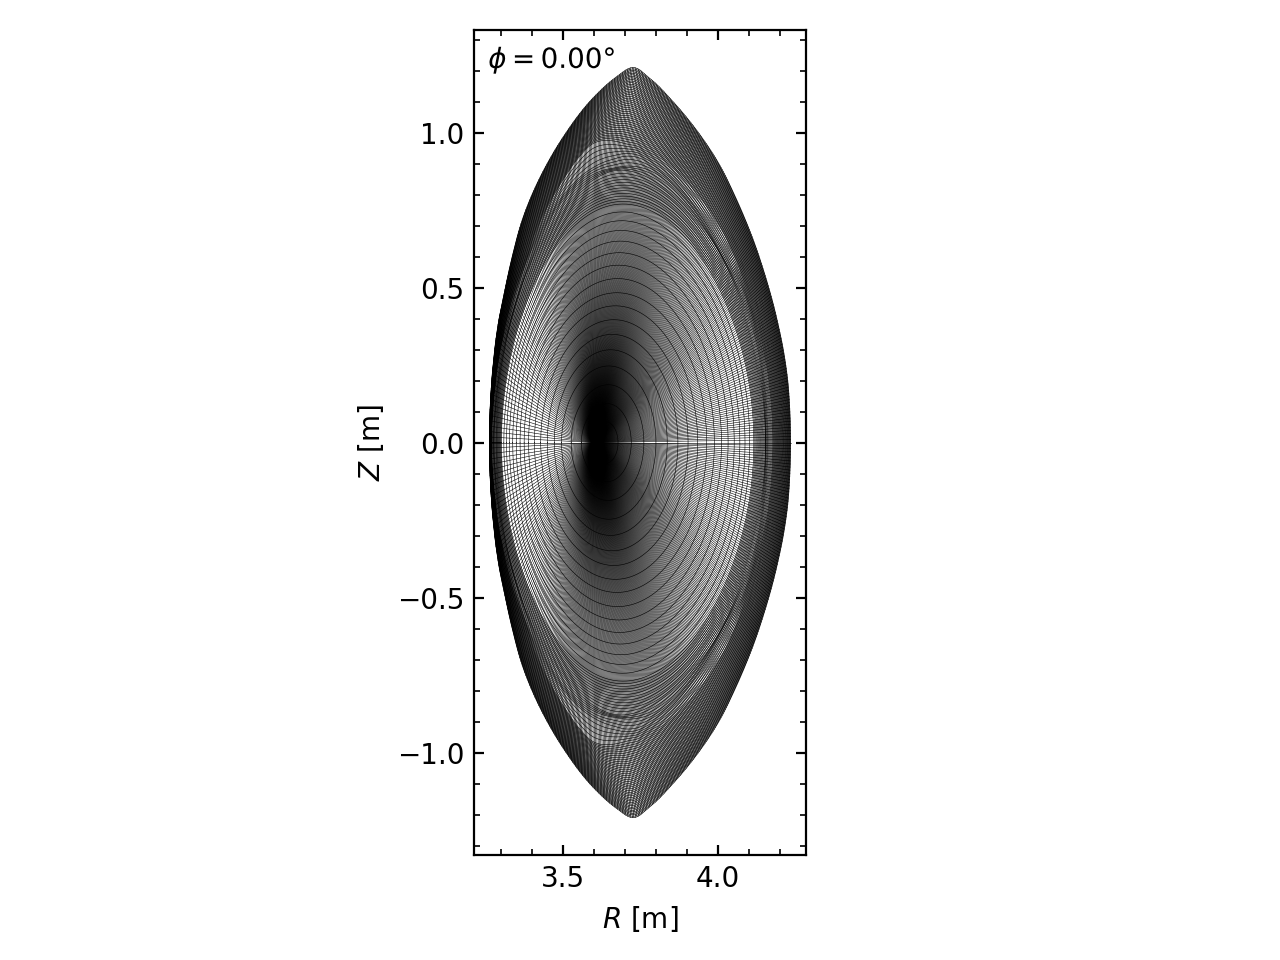
Plotting EMC3-EIRENE-defined grids in \(R–Z\) plane.
This method allows users to plot grid lines at a specific discretized toroidal angle.
- Parameters:
- fig
Figure,optional Matplotlib figure object, by default
fig = plt.figure().- ax
Axes,optional Matplotlib axes object, by default
ax = fig.add_subplot().- n_phi
int,optional Index of toroidal angle, by default 0.
- rz_range
tuple[float,float,float,float],optional Sampling range : \((R_\text{min}, R_\text{max}, Z_\text{min}, Z_\text{max})\), by default None.
- show_phibool
Show toroidal angle text in the plot, by default True.
- indices_radialarray_like,
slice,optional Specify indices of radial direction, by default None. If None, all radial grids are plotted.
- indices_poloidalarray_like,
slice,optional Specify indices of poloidal direction, by default None. If None, all poloidal grids are plotted.
- **kwargs
dict matplotlib.lines.Line2Dproperties, by default{"color": "black", "linewidth": 0.5}.
- fig
- Returns:
Examples
>>> grid = Grid("zone0")
>>> grid.plot(linewidth=0.2)