plot_outline()#
- Grid.plot_outline(phi: float = 0.0, fig: Figure | None = None, ax: Axes | None = None, show_phi: bool = True, **kwargs) tuple[Figure | None, Axes]Source#
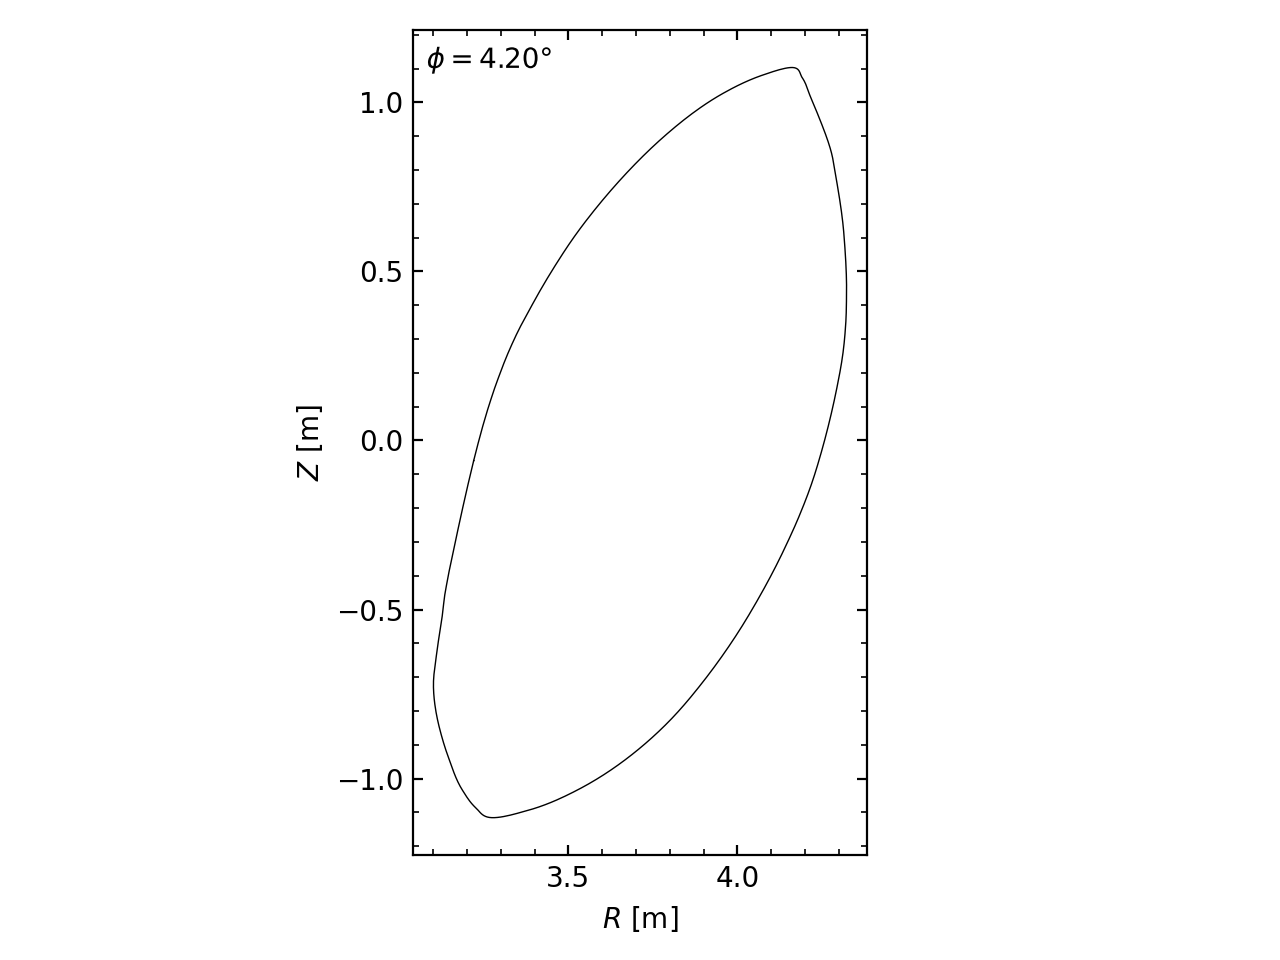
Plotting EMC3-EIRENE-defined grid outline in \(R–Z\) plane.
This method allows users to plot grid outline at a specific toroidal angle \(\varphi\). The toroidal angle is arbitrary, where the grid outline is calculated by linear interpolation between two nearest toroidal grids.
- Parameters:
- phi
float,optional Toroidal grid in [degree], by default 0.0.
- fig
Figure,optional Matplotlib figure object, by default
fig = plt.figure().- ax
Axes,optional Matplotlib axes object, by default
ax = fig.add_subplot().- show_phibool
Show toroidal angle text in the plot, by default True.
- **kwargs
dict matplotlib.lines.Line2Dproperties, by default{"color": "black", "linewidth": 0.5}.
- phi
- Returns:
Examples
>>> grid = Grid("zone0")
>>> grid.plot_outline(4.2)